The Normal Distribution – Why Everybody needs to understand it.
The Normal Distribution is one of the most important and yet a simple concept. Every decision humans and lately the computers make is dependent on some kind of data. Ensuring the relevance and the correctness of the data as much as possible will save us a lot of time wasted by iterating through the wrong decisions. And the Normal distribution is the single most powerful concept in ensuring the correctness of the Data. In this post i will attempt to explain the Normal distribution in a very simplified way based on my understanding.
Every decision we make starts with collecting the relevant data. if we have to buy a product, we check for the features we need in multiple brands, then we check for prices across different vendors or eCommerce places like amazon . Then we lay out the data in a representation convenient to us which will help us to buy the correct product. Now lets do a thought exercise.
Lets say you are visiting a new city for some work and you wanted to find out the time it takes to travel from the airport to your workplace. You have decided to ask a bunch of people at the airport. what do u think the response from most of the people be. Well, Most of the people will respond with approximately the same answer, the actual time it takes to travel from the airport to your workplace. There will also be people who responded with an answer that is not so close to the actual time. Some people would have responded with an answer much higher than actual time and some would have responded with an answer much lower than the actual time.
Lets observe these results in the form of a graphical plot, The plot will look like something below,
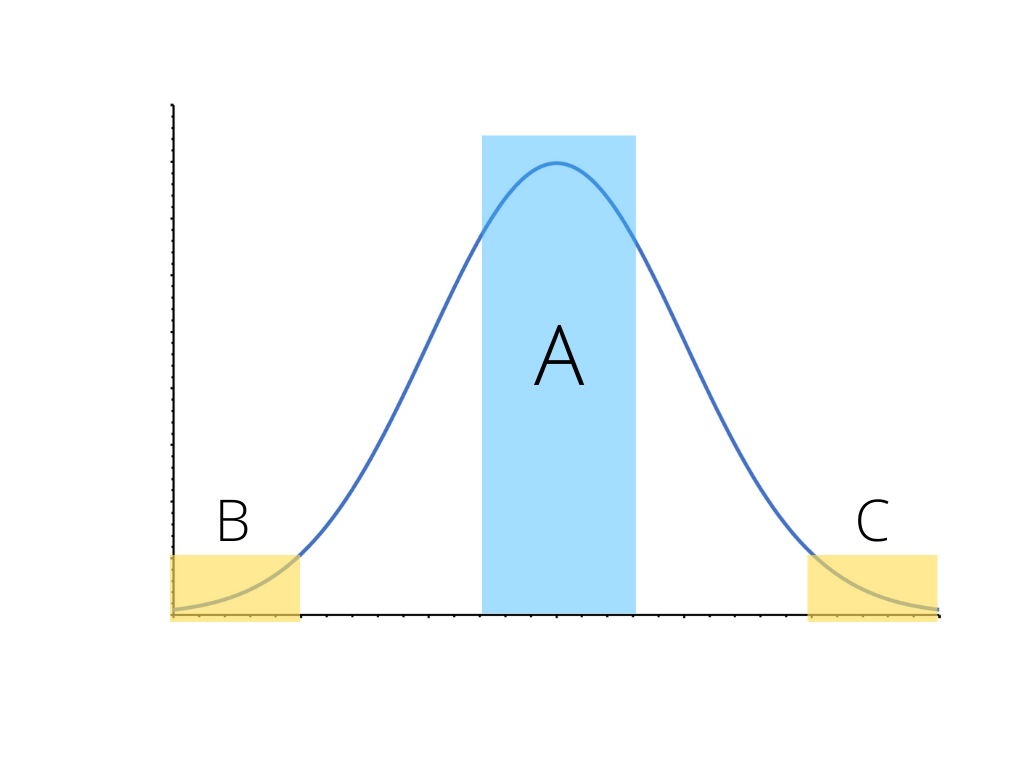
The region A in the middle represents the people who responded with more or less with the actual travel time. The regions B and C represents the people who’s responses were way off the actual time. Now if we take the average of the responses in the region A, it will be very close to the the actual travel time. So if we consider this time as the mean value, we can say that most of the responses are around the mean and very few responses will be far away from the mean value. Now if we check the mean value for this entire data, in fact it will fall within the region A.
This is the fundamental property of the Normal Distribution. Most of the data will be centered around the mean and there will be very less data far away from the mean. we can technically define the limits of the regions A, B and C which are nothing but the other properties of the Normal distribution like the standard deviation.We can extend this thought exercise to any kind of data in the nature, like the grades in a class, no of flights taking off from an airport, no of doctors in Hospitals etc and you will see that all of that data will lead to a plot something similar to the above figure. So Normal distribution is not a mathematical rule imposed on the data, rather it is a phenomena that already exists in the nature and we are only trying to take advantage of it to check the correctness of the data.
Pls note, the above explained procedure is not how a normal distribution is plotted. The procedure is just meant to give an idea about an already existing pattern in the data. In my next post i will explain how a normal distribution is plotted and how the AI/ML world revolves around this powerful concept. I hope this post has helped you to get a clarity of what a normal distribution is.
